Project Management Tools: Gantt Charts
Understanding Lists, Tuples, and Dictionaries in Python

Ask Gemini, not Google assistant!

Goodbye Skype: End of an Era and What It Means for You

Best VPN Services

X Announces Grok-1.5
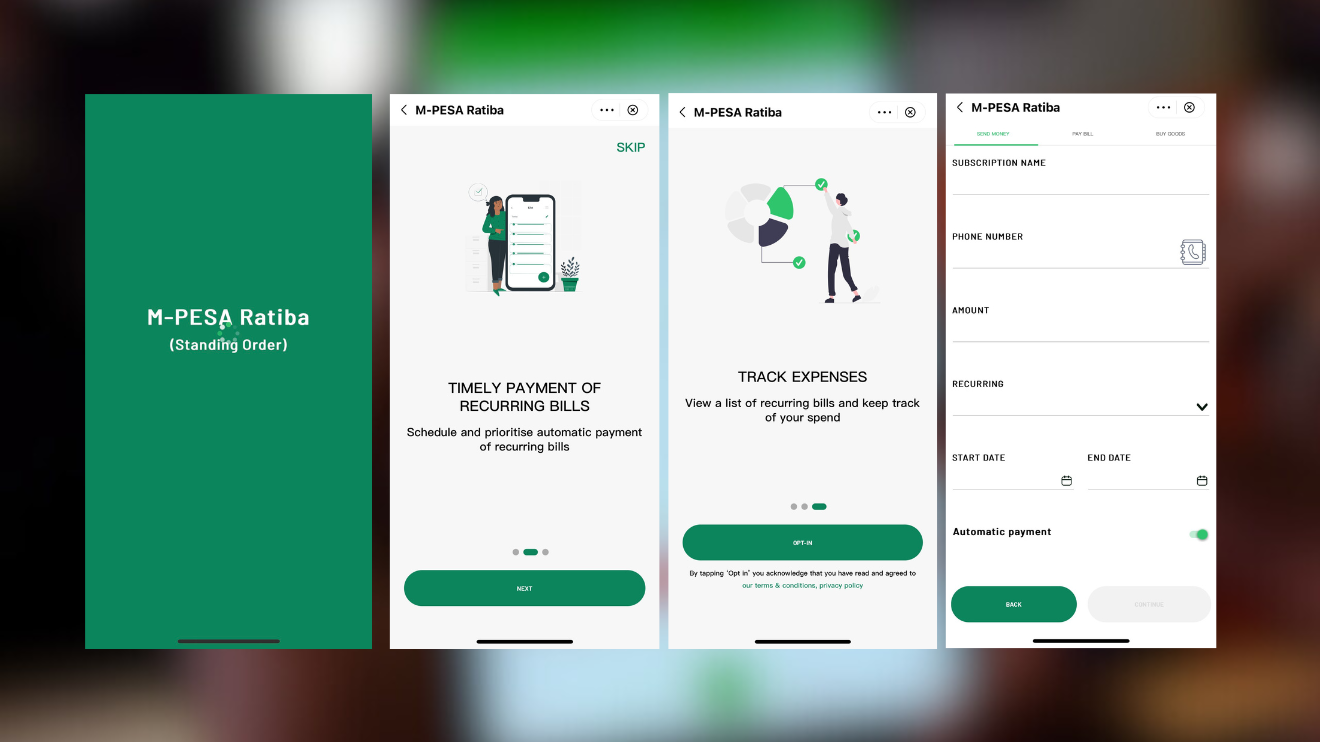
Safaricom Introduces Standing Orders
Staying Safe Online
Project Management Tools: Gantt Charts
Definition
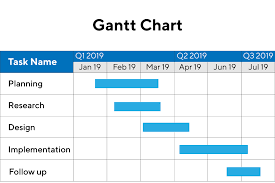
A gantt chart is a project management tool that helps project managers visualize & track the activities against time. Activities on Gantt charts are represented by horizontal bars. The length and position of the bars is determined by the duration, start time and end time of the tasks. In addition, gantt charts are used to show dependencies and constraints between the project activities. So what is a dependency in project management? And what is a constraint? Let’s dive deeper to understand these concepts
DependenciesA dependency is an activity that relies on another activity to start. For instance, let’s assume you have a project to install and configure a computer network for a school. Some of the tasks involved in this project include;
- Agree on the total cost with the client(school)
- Ordering for the necessary equipment (routers, cables, switches)
- Unpacking & testing the equipment
- Installing the physical components of the network
- Configuring the network etc
Activity B can only start if and only if activity A is done. Similarly, activity C cannot start unless activity B is completed. In this case, we can safely say that activity B is a dependency of activity A. Likewise, activity C is a dependency of activity B. This kind of relationship is key when designing a gantt chart because it helps the project manager to ensure tasks are completed in the correct sequence. There are four types of dependencies in project management as discussed below;
- Finish-to-start FS): -- in this kind of dependency, task B cannot start unless task A is finished. This is the most common type of dependency
- Finish-to-finish (FF): -- in this scenario, task B cannot finish unless task A is finished
- Start-to-start (SS): -- in this case, task B cannot start unless task A has started
- Start-to-finish (SF): -- this is where task B can only finish if task A has started
A predecessor task is the task that comes first. A successor, on the other hand, is the task whose start or end is controlled by the predecessor. Dependencies help the project manager to identify potential bottlenecks and optimize resources. This ensures the project is delivered on time.
A lead is the amount of time the project is ahead of schedule. For example, if the predecessor is completed 2 days before the scheduled time, then its successors can start with a lead of 2 days. A lag is the amount of time the successor is behind the schedule. It is affected by delay in completing the predecessor. Arrows are show dependencies on a gantt chart. The arrows point come from the predecessor and point the successor task.
ConstraintsA constraint is a restriction that has a potential effect on the project timeline, resources and deliverables. For instance, a constraint in terms of resources could be human resource, equipment or workspace. On the other hand, external factors such as government approval can also delay the project deliverability. This is another example of a constraint.
How to develop a gantt chart
- Identify the most important project activities
- Order the activities in the correct sequence
- Establish any dependencies among the tasks
- Estimate the duration for each task. This can be calculated from previous experience or computing the average of the worst-case and best-case scenarios
- Assign resources to task, prioritizing the critical tasks
- Visual representation: gantt charts provide a clear, visual representation of project activities, timelines and dependencies
- Task breakdown: gantt charts help break down complex projects into manageable tasks. This makes it easier to track progress and assign resources
- Time management: they allow project managers to visualize task durations, deadline and milestones
- Dependency management: they clearly show which tasks need to be completed first therefore avoiding delays and bottlenecks
- Resource allocation: they help in identifying resources needed for each task, facilitating optimal resource allocation
- Task assignment: the gantt charts clearly show who is responsible for a specific task
- Task duration relies on the experience of the project manager
- Tasks may be too complex to clearly understand their dependencies
- Static & inflexibility: they require manual updates, hence not adaptive to dynamic project requirements
- Time consuming in creating and maintaining
In conclusion, the gantt charts are an important tool in project management. The advantages outweigh the drawbacks.